18,079 zone shifts · 2,883 matches · Sep 15, 2026 to Sep 27, 2026
How far PUBG zones shift, phase by phase
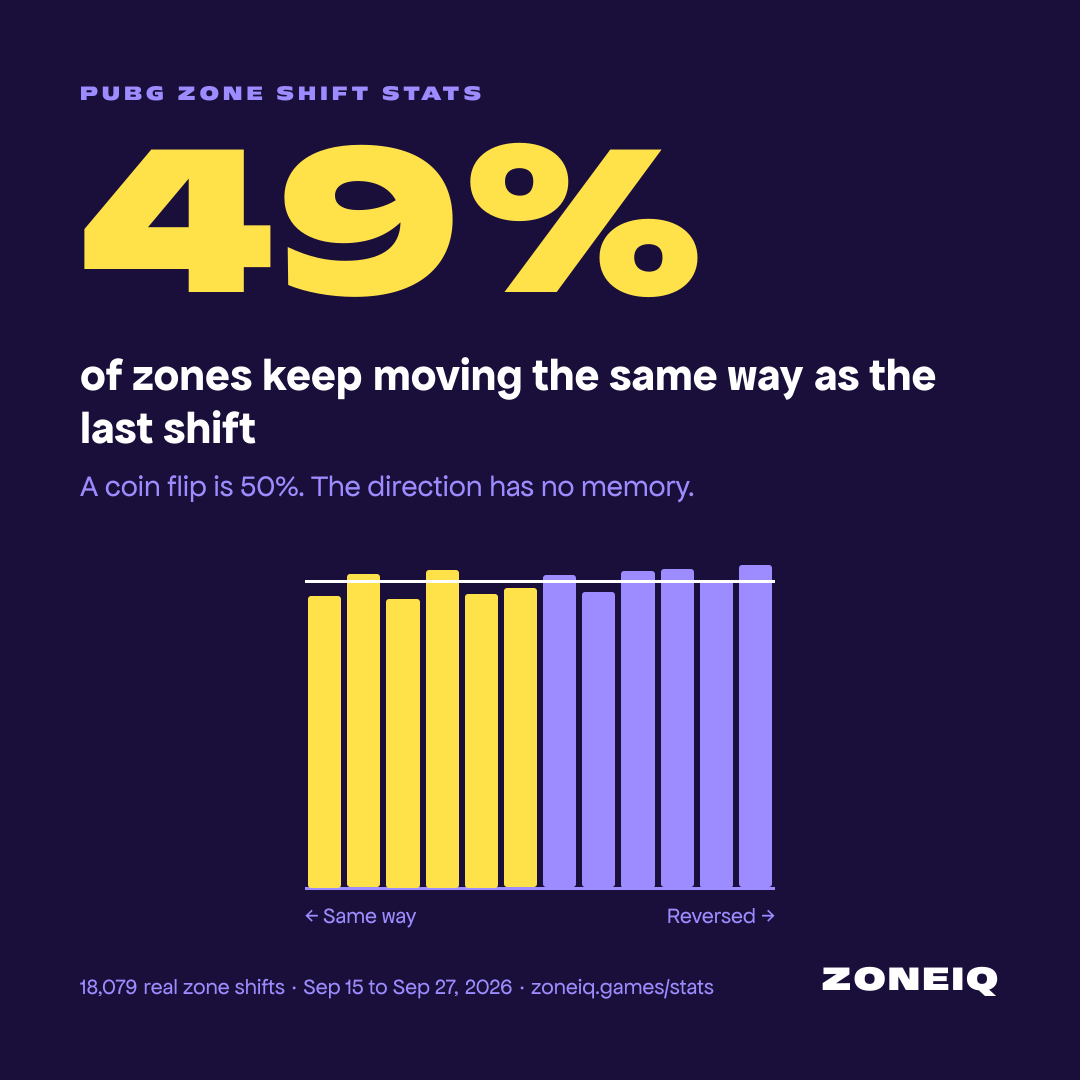
Across 18,079 real zone shifts, the typical zone used 68% on Erangel and 66% on Miramar of the distance it was allowed to move, 17% went 90% or more of the way to the edge, and the direction of one shift said nothing about the next: only 49% kept going the same way. In other words, each new zone lands close to a random spot inside the last one.
- Next shift goes the same way as the last
- 49%
- ±0.8 pts · coin flip 50%
- Zones that hard-shift
- 17%
- ±0.5 pts · random 19%
- Median share of the room used
- 68%
- Erangel · random 71%
- Median Phase 2 move
- 574 m
- Erangel
By map
Every phase on Erangel
Each new zone has to fit inside the last one, so it can move at most the difference between the two radii. The moves shrink with the zones, from about 574 m at Phase 2 to a few metres at the end, but the share of the possible move barely changes. White ticks: what random placement would give (71%).
- Phase 2radius 1,056 m · moved 574 m of 864 m possible · hard 15%66%
- Phase 3radius 634 m · moved 287 m of 423 m possible · hard 18%68%
- Phase 4radius 380 m · moved 172 m of 254 m possible · hard 17%68%
- Phase 5radius 247 m · moved 90 m of 133 m possible · hard 18%68%
- Phase 6radius 161 m · moved 60 m of 87 m possible · hard 18%69%
- Phase 7radius 104 m · moved 38 m of 56 m possible · hard 18%68%
- Phase 8radius 68 m · moved 23 m of 37 m possible · hard 17%64%
Bars: the median share of the possible move used. Medians over 12,289 Erangel zone shifts; phases with fewer than 50 shifts are left out. A hard shift uses 90% or more of the room.
Show the numbers
| Zone | Shifts | Move p25 | Median | p75 | Room used | Hard shift |
|---|---|---|---|---|---|---|
| Phase 2 | 2,000 | 381 m | 574 m | 720 m | 66% | 15% ±1.6 pts |
| Phase 3 | 2,000 | 189 m | 287 m | 360 m | 68% | 18% ±1.7 pts |
| Phase 4 | 2,000 | 120 m | 172 m | 215 m | 68% | 17% ±1.6 pts |
| Phase 5 | 2,000 | 58 m | 90 m | 114 m | 68% | 18% ±1.7 pts |
| Phase 6 | 1,825 | 40 m | 60 m | 74 m | 69% | 18% ±1.8 pts |
| Phase 7 | 1,452 | 25 m | 38 m | 48 m | 68% | 18% ±2.0 pts |
| Phase 8 | 1,012 | 15 m | 23 m | 31 m | 64% | 17% ±2.3 pts |
How much of the room zones use
If the game picked the new centre at random anywhere it fits, big moves would be more common than small ones, simply because there is more space near the edge. Compare the real zones with that shape: slightly fewer moves to the very edge, 17% hard shifts against 19% for pure random placement.
Show the numbers
| Room used | Real | Random placement |
|---|---|---|
| 0-5% | 0.5% | 0.3% |
| 5-10% | 1.2% | 0.8% |
| 10-15% | 2.0% | 1.3% |
| 15-20% | 2.4% | 1.8% |
| 20-25% | 3.0% | 2.3% |
| 25-30% | 3.2% | 2.8% |
| 30-35% | 3.8% | 3.3% |
| 35-40% | 4.3% | 3.8% |
| 40-45% | 4.9% | 4.3% |
| 45-50% | 5.0% | 4.8% |
| 50-55% | 5.3% | 5.3% |
| 55-60% | 5.5% | 5.8% |
| 60-65% | 5.9% | 6.3% |
| 65-70% | 6.6% | 6.8% |
| 70-75% | 6.9% | 7.2% |
| 75-80% | 7.3% | 7.8% |
| 80-85% | 7.6% | 8.3% |
| 85-90% | 7.7% | 8.8% |
| 90-95% | 8.6% | 9.3% |
| 95-100% | 8.7% | 9.8% |
Does the zone keep going the same way?
The angle between one shift and the next in the same match. If shifts followed a direction, the bars would pile up near 0°. They are flat: 49% of next shifts went within 90° of the last one (±1.0 pts), where a coin flip gives 50%.
Show the numbers
| Angle | Share |
|---|---|
| 0-15° | 7.9% |
| 15-30° | 8.5% |
| 30-45° | 7.6% |
| 45-60° | 8.7% |
| 60-75° | 8.0% |
| 75-90° | 8.1% |
| 90-105° | 8.5% |
| 105-120° | 8.2% |
| 120-135° | 8.7% |
| 135-150° | 8.6% |
| 150-165° | 8.2% |
| 165-180° | 9.0% |
Every phase on Miramar
Each new zone has to fit inside the last one, so it can move at most the difference between the two radii. The moves shrink with the zones, from about 587 m at Phase 2 to a few metres at the end, but the share of the possible move barely changes. White ticks: what random placement would give (71%).
- Phase 2radius 1,056 m · moved 587 m of 864 m possible · hard 18%68%
- Phase 3radius 634 m · moved 292 m of 423 m possible · hard 19%69%
- Phase 4radius 380 m · moved 170 m of 254 m possible · hard 16%67%
- Phase 5radius 247 m · moved 87 m of 133 m possible · hard 17%65%
- Phase 6radius 161 m · moved 58 m of 87 m possible · hard 16%67%
- Phase 7radius 104 m · moved 38 m of 56 m possible · hard 16%68%
- Phase 8radius 68 m · moved 15 m of 37 m possible · hard 10%40%
Bars: the median share of the possible move used. Medians over 5,790 Miramar zone shifts; phases with fewer than 50 shifts are left out. A hard shift uses 90% or more of the room.
Show the numbers
| Zone | Shifts | Move p25 | Median | p75 | Room used | Hard shift |
|---|---|---|---|---|---|---|
| Phase 2 | 883 | 381 m | 587 m | 741 m | 68% | 18% ±2.5 pts |
| Phase 3 | 883 | 198 m | 292 m | 365 m | 69% | 19% ±2.6 pts |
| Phase 4 | 883 | 116 m | 170 m | 214 m | 67% | 16% ±2.4 pts |
| Phase 5 | 883 | 61 m | 87 m | 111 m | 65% | 17% ±2.5 pts |
| Phase 6 | 865 | 38 m | 58 m | 73 m | 67% | 16% ±2.5 pts |
| Phase 7 | 788 | 26 m | 38 m | 48 m | 68% | 16% ±2.5 pts |
| Phase 8 | 605 | 10 m | 15 m | 28 m | 40% | 10% ±2.4 pts |
How much of the room zones use
If the game picked the new centre at random anywhere it fits, big moves would be more common than small ones, simply because there is more space near the edge. Compare the real zones with that shape: slightly fewer moves to the very edge, 16% hard shifts against 19% for pure random placement.
Show the numbers
| Room used | Real | Random placement |
|---|---|---|
| 0-5% | 0.4% | 0.3% |
| 5-10% | 1.3% | 0.8% |
| 10-15% | 2.0% | 1.3% |
| 15-20% | 2.8% | 1.8% |
| 20-25% | 3.3% | 2.3% |
| 25-30% | 3.3% | 2.8% |
| 30-35% | 4.5% | 3.3% |
| 35-40% | 5.3% | 3.8% |
| 40-45% | 5.1% | 4.3% |
| 45-50% | 4.7% | 4.8% |
| 50-55% | 5.1% | 5.3% |
| 55-60% | 5.2% | 5.8% |
| 60-65% | 6.2% | 6.3% |
| 65-70% | 6.0% | 6.8% |
| 70-75% | 7.1% | 7.2% |
| 75-80% | 6.6% | 7.8% |
| 80-85% | 7.4% | 8.3% |
| 85-90% | 7.3% | 8.8% |
| 90-95% | 8.1% | 9.3% |
| 95-100% | 8.3% | 9.8% |
Does the zone keep going the same way?
The angle between one shift and the next in the same match. If shifts followed a direction, the bars would pile up near 0°. They are flat: 50% of next shifts went within 90° of the last one (±1.4 pts), where a coin flip gives 50%.
Show the numbers
| Angle | Share |
|---|---|
| 0-15° | 8.1% |
| 15-30° | 8.5% |
| 30-45° | 8.3% |
| 45-60° | 8.6% |
| 60-75° | 7.9% |
| 75-90° | 8.2% |
| 90-105° | 8.5% |
| 105-120° | 7.7% |
| 120-135° | 8.5% |
| 135-150° | 8.8% |
| 150-165° | 8.8% |
| 165-180° | 8.2% |
What this means when you play
- Plan for a big move: on Erangel, half of all zones use 68% or more of the distance they could move, and 17% go 90% or more of the way to the edge.
- "It went east, so it'll keep going east" doesn't hold. The next shift is as likely to swing back as to continue, so position for the whole current zone, not the trend.
- The sizes are fixed, so the most a zone can move is known in advance: use the table above as a rotation budget.
How this was measured
Data. 2,000 Erangel matches (Sep 22, 2026 to Sep 27, 2026) and 883 Miramar matches (Sep 15, 2026 to Sep 27, 2026), all completed matches in standard modes from PUBG's public match samples, obtained through the official PUBG Developer API.
A shift is the move from one zone's centre to the next zone's centre in the same match, in metres. Room used divides it by the most the zone could have moved while staying inside the previous zone (previous radius minus new radius). A hard shift uses 90% or more. The final collapse of the last circle to a point is not a shift and is ignored. Phases with fewer than 50 shifts are not reported.
Turn angle is the angle between two consecutive shifts in the same match (0° = same direction, 180° = straight back). "Same way" means under 90°.
Random placement assumes the new centre is equally likely anywhere it fits. Then the share of room used, u, has density 2u: a median of 71% and 19% of zones at 90% or more. With no link between shifts, every 15° band of turn angle would hold 1/12 (8.3%).
Margins. ± figures are 95% margins of error for a share (normal approximation). This is a recent sample, not every match ever played, and zone rules can change with game updates. The page is recalculated daily as new matches are added.
Reproduce it. Every number above is in the JSON download with the definitions above (free to reuse with a link, CC BY 4.0). The download and this page are produced by the same calculation.
Test your read
Zones don't follow a trend, but they do follow rules. See the first two zones of a real match and call where the final circle closes.
Play today's Erangel 5