2,883 matches · Sep 15, 2026 to Sep 27, 2026
How far the final circle lands from Phase 2
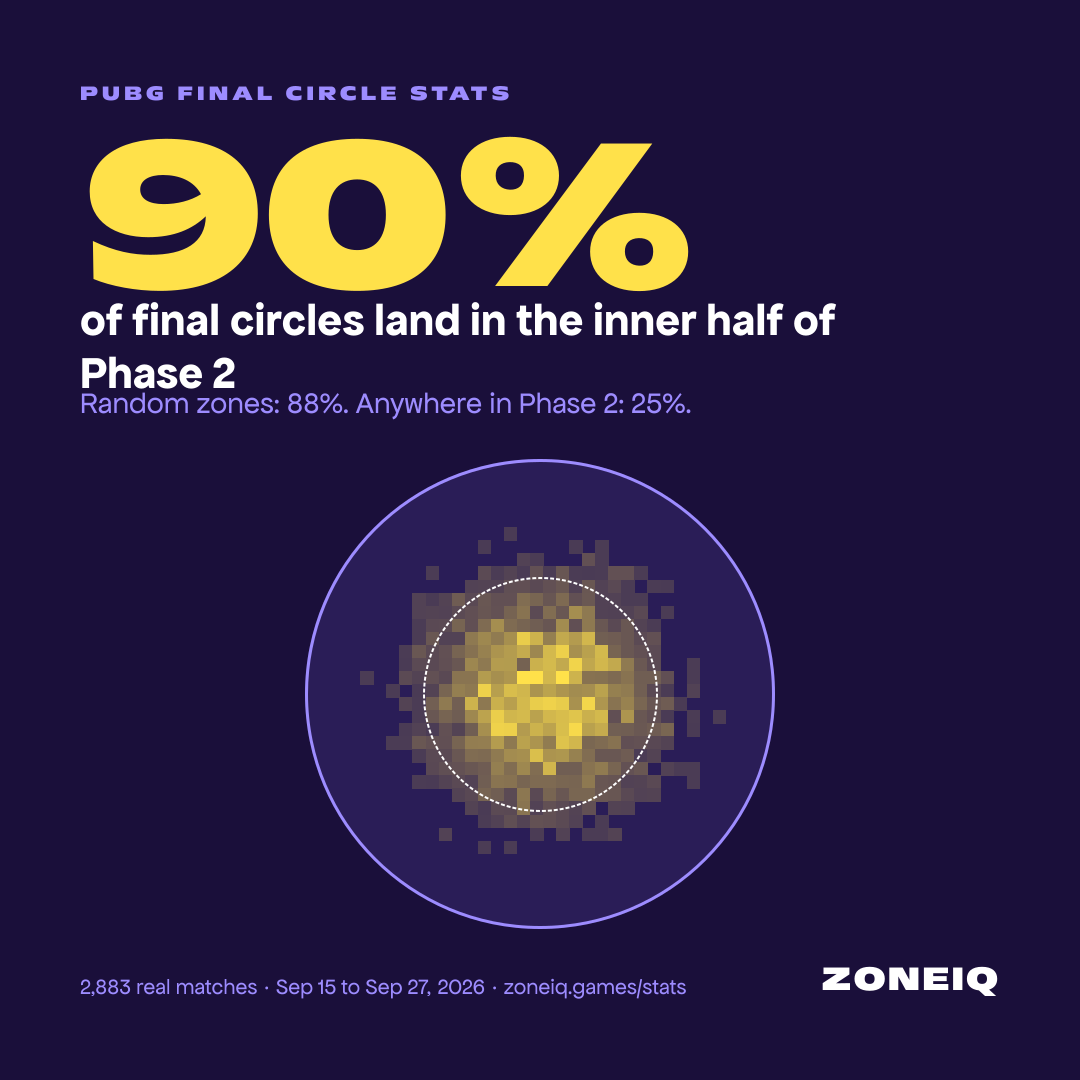
In 2,883 real PUBG matches, 90% of final circles landed in the inner half of Phase 2, a median 305 m on Erangel and 307 m on Miramar from its centre. Only 1 of 2,883 landed in the outer quarter. That is not the game favouring the centre: placing every later zone at random gives almost the same result.
- Final circle in the inner half of Phase 2
- 90%
- ±1.1 pts
- In the inner quarter
- 39%
- ±1.8 pts
- In the outer quarter
- 1 of 2,883
- matches
- Median distance from the P2 centre
- 29%
- of its radius · Erangel
Why the final circle stays near the Phase 2 centre
Every zone must fit inside the one before it, and each is 60% to 65% of the previous radius. After six or seven shrinks, the small moves add up to far less than the Phase 2 radius, so the end game rarely reaches the edge of Phase 2. We checked this by replaying every match with each later zone placed at random wherever the game allows (keeping the real zone sizes): the inner-half share comes out at 88%, against 90% in real matches. If the final circle could land anywhere inside Phase 2 with equal chance, it would be only 25%.
Final circle in the inner half of Phase 2
- Real matches90%
- Random zones88%
- Anywhere in P225%
In the inner quarter
- Real matches39%
- Random zones35%
- Anywhere in P26%
By map
Where inside Phase 2 the final circle lands
On Erangel, half of all final circles landed within 29% of the Phase 2 radius (305 m) of its centre, and nine in ten within 50%. The bright core is the centre of Phase 2, not a place on the map.
Distance as a share of the Phase 2 radius
Gold: real Erangel matches. White: the same matches with every later zone placed at random where the game allows it. The two shapes nearly match: the pull toward the Phase 2 centre is geometry.
Show the numbers
| Band | Real | Random zones |
|---|---|---|
| 0-5% | 1.4% | 1.6% |
| 5-10% | 5.3% | 4.6% |
| 10-15% | 8.8% | 7.6% |
| 15-20% | 10.3% | 10.2% |
| 20-25% | 13.2% | 11.3% |
| 25-30% | 13.6% | 12.1% |
| 30-35% | 11.7% | 12.4% |
| 35-40% | 10.7% | 11.4% |
| 40-45% | 8.5% | 9.4% |
| 45-50% | 6.7% | 7.7% |
| 50-55% | 4.9% | 5.6% |
| 55-60% | 2.9% | 3.5% |
| 60-65% | 1.5% | 1.9% |
| 65-70% | 0.4% | 0.6% |
| 70-75% | 0.3% | 0.2% |
| 75-80% | 0.1% | 0.1% |
| 80-85% | 0.0% | 0.0% |
| 85-90% | 0.0% | 0.0% |
| 90-95% | 0.0% | 0.0% |
| 95-100% | 0.0% | 0.0% |
In metres
Phase 2 on Erangel has a radius of about 1,056 m and the final circle about 68 m. The final centre was a median 305 m from the Phase 2 centre; a quarter of finals were within 209 m, and one in ten more than 528 m away (furthest: 807 m).
Show the numbers
| Distance | Share |
|---|---|
| 0-50 m | 1.3% |
| 50-100 m | 4.7% |
| 100-150 m | 7.8% |
| 150-200 m | 9.4% |
| 200-250 m | 12.3% |
| 250-300 m | 13.4% |
| 300-350 m | 11.3% |
| 350-400 m | 10.1% |
| 400-450 m | 9.3% |
| 450-500 m | 7.3% |
| 500-550 m | 5.3% |
| 550-600 m | 3.9% |
| 600-650 m | 2.3% |
| 650-700 m | 1.2% |
| 700-750 m | 0.3% |
| 750-800 m | 0.1% |
| 800-850 m | 0.1% |
| 850-900 m | 0.0% |
Which way it pulls
Every direction gets between 5.1% and 6.9% of final circles, close to the even 6.25%. The final circle was on the map-centre side of Phase 2 in 53% of matches (±2.2 pts; a coin flip is 50%).
Show the numbers
| Sector | Share |
|---|---|
| N | 5.1% |
| NNE | 6.8% |
| NE | 6.8% |
| ENE | 5.4% |
| E | 6.5% |
| ESE | 6.9% |
| SE | 6.6% |
| SSE | 6.0% |
| S | 5.5% |
| SSW | 6.9% |
| SW | 6.0% |
| WSW | 6.6% |
| W | 6.3% |
| WNW | 5.8% |
| NW | 6.4% |
| NNW | 6.5% |
Six real Erangel endings
Real matches drawn to scale inside their own Phase 2 (outer ring), picked at fixed points of the distribution: from a close final (10th percentile) to one of the furthest (99th). Gold is the final circle; thin rings are the zones in between.
12% of the radius (128 m), the 10th percentile
21% of the radius (227 m), the 30th percentile
29% of the radius (305 m), the 50th percentile
38% of the radius (399 m), the 70th percentile
50% of the radius (528 m), the 90th percentile
64% of the radius (674 m), the 99th percentile
Where inside Phase 2 the final circle lands
On Miramar, half of all final circles landed within 29% of the Phase 2 radius (307 m) of its centre, and nine in ten within 50%. The bright core is the centre of Phase 2, not a place on the map.
Distance as a share of the Phase 2 radius
Gold: real Miramar matches. White: the same matches with every later zone placed at random where the game allows it. The two shapes nearly match: the pull toward the Phase 2 centre is geometry.
Show the numbers
| Band | Real | Random zones |
|---|---|---|
| 0-5% | 2.3% | 1.5% |
| 5-10% | 4.4% | 4.6% |
| 10-15% | 8.8% | 7.6% |
| 15-20% | 9.5% | 10.1% |
| 20-25% | 12.7% | 11.4% |
| 25-30% | 15.2% | 11.9% |
| 30-35% | 11.0% | 12.1% |
| 35-40% | 9.6% | 11.4% |
| 40-45% | 9.6% | 10.0% |
| 45-50% | 6.5% | 7.7% |
| 50-55% | 6.0% | 5.5% |
| 55-60% | 2.7% | 3.3% |
| 60-65% | 0.9% | 1.8% |
| 65-70% | 0.8% | 0.8% |
| 70-75% | 0.0% | 0.2% |
| 75-80% | 0.0% | 0.1% |
| 80-85% | 0.0% | 0.0% |
| 85-90% | 0.0% | 0.0% |
| 90-95% | 0.0% | 0.0% |
| 95-100% | 0.0% | 0.0% |
In metres
Phase 2 on Miramar has a radius of about 1,056 m and the final circle about 68 m. The final centre was a median 307 m from the Phase 2 centre; a quarter of finals were within 213 m, and one in ten more than 533 m away (furthest: 735 m).
Show the numbers
| Distance | Share |
|---|---|
| 0-50 m | 2.0% |
| 50-100 m | 3.7% |
| 100-150 m | 7.7% |
| 150-200 m | 9.3% |
| 200-250 m | 11.8% |
| 250-300 m | 12.9% |
| 300-350 m | 11.6% |
| 350-400 m | 10.4% |
| 400-450 m | 8.6% |
| 450-500 m | 8.0% |
| 500-550 m | 6.8% |
| 550-600 m | 4.0% |
| 600-650 m | 2.0% |
| 650-700 m | 0.8% |
| 700-750 m | 0.3% |
| 750-800 m | 0.0% |
| 800-850 m | 0.0% |
| 850-900 m | 0.0% |
Which way it pulls
Every direction gets between 5.1% and 7.6% of final circles, close to the even 6.25%. The final circle was on the map-centre side of Phase 2 in 51% of matches (±3.3 pts; a coin flip is 50%).
Show the numbers
| Sector | Share |
|---|---|
| N | 5.8% |
| NNE | 7.2% |
| NE | 7.6% |
| ENE | 5.2% |
| E | 6.3% |
| ESE | 6.2% |
| SE | 6.3% |
| SSE | 5.7% |
| S | 5.8% |
| SSW | 6.7% |
| SW | 6.5% |
| WSW | 7.2% |
| W | 5.1% |
| WNW | 6.3% |
| NW | 6.8% |
| NNW | 5.2% |
Six real Miramar endings
Real matches drawn to scale inside their own Phase 2 (outer ring), picked at fixed points of the distribution: from a close final (10th percentile) to one of the furthest (99th). Gold is the final circle; thin rings are the zones in between.
12% of the radius (125 m), the 10th percentile
22% of the radius (236 m), the 30th percentile
29% of the radius (307 m), the 50th percentile
38% of the radius (401 m), the 70th percentile
50% of the radius (533 m), the 90th percentile
62% of the radius (658 m), the 99th percentile
What this means when you play
- Once Phase 2 shows, the inner half of it is where the end game was in 90% of these matches. Rotating early toward the middle of Phase 2 is rarely wasted.
- Don't expect the dead centre either: only 7% of final circles landed within 10% of the Phase 2 radius of its centre.
- There is no favourite direction. Terrain and the next zones decide it, not a rule of thumb.
How this was measured
Data. 2,000 Erangel matches (Sep 22, 2026 to Sep 27, 2026) and 883 Miramar matches (Sep 15, 2026 to Sep 27, 2026), all completed matches in standard modes from PUBG's public match samples, obtained through the official PUBG Developer API. A match is counted when its zones reached at least Phase 3. Map pages with fewer than 100 matches are not published.
Final circle. The last zone recorded for the match with a real size (the game's closing collapse to a point, at the same spot, is ignored). The distance is measured centre to centre, in metres, and as a share of the Phase 2 radius (0% = the Phase 2 centre, 100% = its edge).
Margins. ± figures are 95% margins of error for a share (normal approximation). Medians and percentiles are exact for this sample.
Random zones. Each match is replayed 20 times from its real Phase 2, keeping its real zone sizes, but putting each new centre at a uniformly random point where it still fits inside the previous zone. The generator uses a fixed seed, so the baseline is the same on every run. "Anywhere in P2" is the simpler comparison of a point placed uniformly inside the Phase 2 disc.
Limits. This is a recent sample, not every match ever played, and zone rules can change with game updates. The page is recalculated daily as new matches are added. Examples are real matches picked at fixed percentiles; no match or player IDs are published.
Reproduce it. Every number above is in the JSON download with the definitions above (free to reuse with a link, CC BY 4.0). The download and this page are produced by the same calculation.
Test your read
You have seen the averages. Now call it: see the first two zones of a real match and mark where the final circle closes.
Play today's Erangel 5